URL Example: https://yoursite.cloud.test.dynamics.com/en/?cmp=USMF&debug=develop
Note: When you run in debug mode you will notice slower performance. You can quickly get an overview of most performance issues by pressing F12 and working with the debugging tools that are available in your browser.
In order to open the performance timer window you need to click the timer.
Here you can see three different tabs in which you can view the performance related statistics.
History Tab: It shows the number of calls occur opening a form. You can see the details by clicking the event showing in list.
Server Calls Tab: As its name describes, It contains the server call information.
Server Performance Counters Tab: In this tab there are four server performance counters that provides segregated server related information.
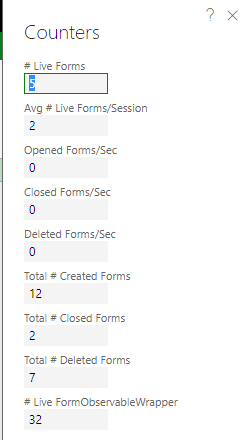
Forms: It shows how many forms are currently opened, opened/second, closed per second and a set of other counters like the total amount of created forms or closed forms.
GC (Garbage collector): It gives you information about the garbage collection processes on the server.
Web Client Session: It tells you how many web client sessions you currently have and how many are in use.
Services Session provider: This is the total amount of sessions created.
That is all, this screen will give you a head start in what to trace, where to start trouble shooting and what forms takes more time with client & server executions.
If you wants to read the Microsoft documentation at this topic you can read it through this link Performance timer.


No comments:
Post a Comment